
Page 1 of 1
| Time Location Chart 01/06/2014 at 01:08 #61190 | |
|
CTCThiago
232 posts |
Anyone has any software to build up a TL chart (Timetable), I got some softwares, but none heading to railways... Regards, Thiago. Log in to reply |
| Time Location Chart 01/06/2014 at 03:03 #61191 | |
|
GeoffM
6424 posts |
There's a way to do it in Excel, sort of, but rather convoluted and haphazard compared to its other graphing tools. Sorry, I forget the detail of how.
SimSig Boss Log in to reply The following user said thank you: CTCThiago |
| Time Location Chart 01/06/2014 at 11:27 #61202 | |
|
GW43125
495 posts |
Please excuse my stupidity, but could someone please tell me what a Time Location Chart is? Thanks, DSW. Last edited: 01/06/2014 at 11:28 by GW43125 Log in to reply |
| Time Location Chart 01/06/2014 at 12:12 #61207 | |
|
JamesN
1626 posts |
" said:Please excuse my stupidity, but could someone please tell me what a Time Location Chart is?It's a graphical way of displaying a timetable. Time is shown on the X (horizontal) axis, locations on the Y (vertical) axis. Trains are shown as an XY plot. Log in to reply |
| Time Location Chart 01/06/2014 at 12:23 #61209 | |
|
Finger
220 posts |
" said:" said:Please excuse my stupidity, but could someone please tell me what a Time Location Chart is?It's a graphical way of displaying a timetable. Time is shown on the X (horizontal) axis, locations on the Y (vertical) axis. Trains are shown as an XY plot. So, would this be correctly called a time-location chart? Log in to reply |
| Time Location Chart 01/06/2014 at 13:22 #61212 | |
|
postal
5338 posts |
" said:" said:It's how TTs were created on Britain's railways before the advent of computers. Even in the 1990s, if we asked the railway for a path for one of our company trains they would go away and "look at the graph to see if there was any white space".Please excuse my stupidity, but could someone please tell me what a Time Location Chart is?It's a graphical way of displaying a timetable. Time is shown on the X (horizontal) axis, locations on the Y (vertical) axis. Trains are shown as an XY plot. “In life, there is always someone out there, who won’t like you, for whatever reason, don’t let the insecurities in their lives affect yours.” – Rashida Rowe Log in to reply |
| Time Location Chart 01/06/2014 at 13:36 #61213 | |
|
GW43125
495 posts |
Thank you all for that!
Log in to reply |
| Time Location Chart 01/06/2014 at 14:20 #61214 | |
|
postal
5338 posts |
" said:There's a way to do it in Excel, sort of, but rather convoluted and haphazard compared to its other graphing tools. Sorry, I forget the detail of how.You can export a SimSig TT to CSV format using the tool on the F4 TT editor window and work from there with Excel. However, you need to write a macro or formula to change the passing times from the railway format of 00/00 to the conventional 00:00 and also one to convert the 00:00h or 00/00h times to 00:00:30. If you want a realistic graph in terms of the slopes/gradients of the various timing sectors, you need to find the distances between the various timing points and use those distances as your reference for the Y-axis rather than just an equal step between each location. At various stages over the years, I've put formulae together to do all of the format changes to the times. If anyone is really interested, send me a PM and we can sort out what is needed. “In life, there is always someone out there, who won’t like you, for whatever reason, don’t let the insecurities in their lives affect yours.” – Rashida Rowe Log in to reply |
| Time Location Chart 01/06/2014 at 19:57 #61231 | |
|
Forest Pines
529 posts |
I've always thought they were called "train path diagrams", but I could be wrong there. Can't remember where I first read that name. I once was given a visit to the Ffestiniog Railway's Control, and noticed that their controllers operate their railways entirely by using these. They have the timetabled graph for the day in front of them, and start off with a second, blank, graph. As they authorise each movement and token release (by phone), they draw it on the blank graph, instead of using a train register. Log in to reply The following user said thank you: CTCThiago |
| Time Location Chart 01/06/2014 at 20:17 #61232 | |
|
dannywith
4 posts |
Not directly SimSig related, but there's a whole host of timetable graphs available on the 2D53 website. They're mainly from the 60's and 70's and are concentrated around North Wales (so may be of some limited use for the NWC route). Either way, I'm a fan of them  Link to diagrams - http://www.2d53.co.uk/graph/GRmenu.htm Working to create an accurate national railway timetable - railwaydata.co.uk Log in to reply |
| Time Location Chart 01/06/2014 at 20:49 #61233 | |
|
Gwasanaethau
511 posts |
This idea might actually help me with my timetables too. I have lots of clashes that still need working out. Thanks for the idea!
Log in to reply The following user said thank you: CTCThiago |
| Time Location Chart 01/06/2014 at 23:09 #61234 | |
|
CTCThiago
232 posts |
" said:I've always thought they were called "train path diagrams", but I could be wrong there. Can't remember where I first read that name.1. Railway Company TLC: 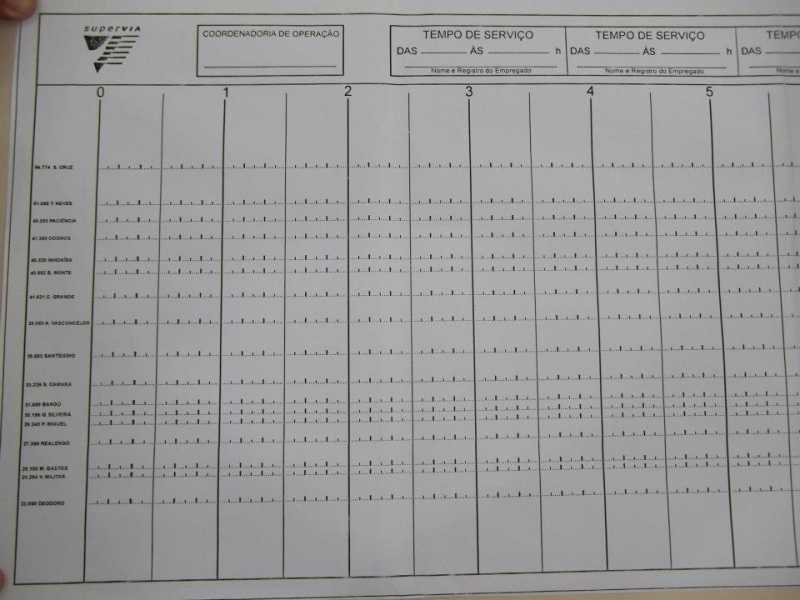 Mate, Thanks for the information, I'll do a TLC for King's Cross, I'm working how i will split the ECML and the Loop, maybe i'll create separated TLC's for sections (LN). Regards, Thiago. Post has attachments. Log in to view them. Last edited: 01/06/2014 at 23:11 by CTCThiago Log in to reply |
| Time Location Chart 02/06/2014 at 01:32 #61235 | |
|
CTCThiago
232 posts |
" said:There's a way to do it in Excel, sort of, but rather convoluted and haphazard compared to its other graphing tools. Sorry, I forget the detail of how.Geoff, sorry to be rude but, is there any possibility to implement a TLC to SimSig? or it will be off the patterns of modern simulator? Ps. I Don't know if they use charts instead. Thiago. Log in to reply |
| Time Location Chart 02/06/2014 at 07:46 #61237 | |
|
Hooverman
306 posts |
" said:" said:I love the idea of this (train graphs), then all we need to do is add train crew and unit diagrams, a function for running possession through the program link it to advanced ARS and make it scalable and bingo SimSig turns into a TMS lite :-) lolThere's a way to do it in Excel, sort of, but rather convoluted and haphazard compared to its other graphing tools. Sorry, I forget the detail of how.Geoff, sorry to be rude but, is there any possibility to implement a TLC to SimSig? or it will be off the patterns of modern simulator? I'm happy with SimSig the way it is. But joking aside, with all this new techno coming our way and if Geoff & co choose to add or not add some more modern functions as an overlay then I can see that adding some more fun and stress as the simulation models the new modern railway. Log in to reply |
| Time Location Chart 02/06/2014 at 08:12 #61240 | |
|
Forest Pines
529 posts |
There is a competitor's signalling simulator that includes a graph view of the timetable. But their sims are a lot more expensive!
Log in to reply |
| Time Location Chart 03/06/2014 at 03:29 #61271 | |
|
CTCThiago
232 posts |
" said:There is a competitor's signalling simulator that includes a graph view of the timetable. But their sims are a lot more expensive!Not interested in a competitor's software  , it is just an idea for SimSig. I'll try the Chart on excel. , it is just an idea for SimSig. I'll try the Chart on excel.
Log in to reply |
| Time Location Chart 03/06/2014 at 04:07 #61272 | |
|
GeoffM
6424 posts |
" said:" said:The only mainline railway in the UK that I know uses train graphs as a live signalling/regulation tool (as opposed to timetable planning) is the Channel Tunnel. However, as Hooverman said, the plans are for signallers to get TMS (Traffic Management System) which does include string graphs and platform occupancy graphs.There's a way to do it in Excel, sort of, but rather convoluted and haphazard compared to its other graphing tools. Sorry, I forget the detail of how.Geoff, sorry to be rude but, is there any possibility to implement a TLC to SimSig? or it will be off the patterns of modern simulator? SimSig Boss Log in to reply The following user said thank you: CTCThiago |
| Time Location Chart 03/06/2014 at 16:44 #61281 | |
|
BoxBoyKit
166 posts |
Not a mainline, but we currently use them (or have them available to be used) to Signalman to ensure the correct trains are sent with the Staff or a Ticket in Staff & Ticket areas, so as to save causing delay by sending a train with the wrong one! (And a lot of embarrassment on the part of the signalman!)
Log in to reply The following user said thank you: CTCThiago |
| Time Location Chart 01/08/2014 at 19:26 #63401 | |
|
GW43125
495 posts |
Hi all, Sorry to bump this thread but does anyone know of a way I can make a TLC for a timetable I plan to write? Thanks in advance, Jamie. Log in to reply |
| Time Location Chart 01/08/2014 at 19:34 #63402 | |
|
CTCThiago
232 posts |
" said:Hi all,I'm working on a excel chart, the graph works already the way it's mean to be, Barry help me on this, and i'm working on to improve the interface of data input. Thiago. Log in to reply |